September 30, 2025
Website Analytics for Small Business: What Numbers Actually Matter
TL;DR
Most small business owners open Google Analytics, feel overwhelmed, and close the tab. This breaks down the metrics that actually tell you something useful and what to do about them.
In This Article
TL;DR
- Most small business owners get overwhelmed by analytics data and focus on vanity metrics
- The 8 essential metrics that actually impact your bottom line: traffic sources, conversion rate, bounce rate, page speed, mobile usage, top pages, goal completions, and search performance
- Google Analytics setup and dashboard configuration for small business priorities
- How to turn analytics insights into actionable business decisions
- Monthly analytics review process that takes 30 minutes but drives real results
In This Article
- Why Most Small Businesses Get Analytics Wrong
- The 8 Website Metrics That Actually Matter
- Setting Up Google Analytics for Small Business
- Reading Your Analytics Dashboard
- Turning Data Into Action
- Common Analytics Mistakes
- FAQ
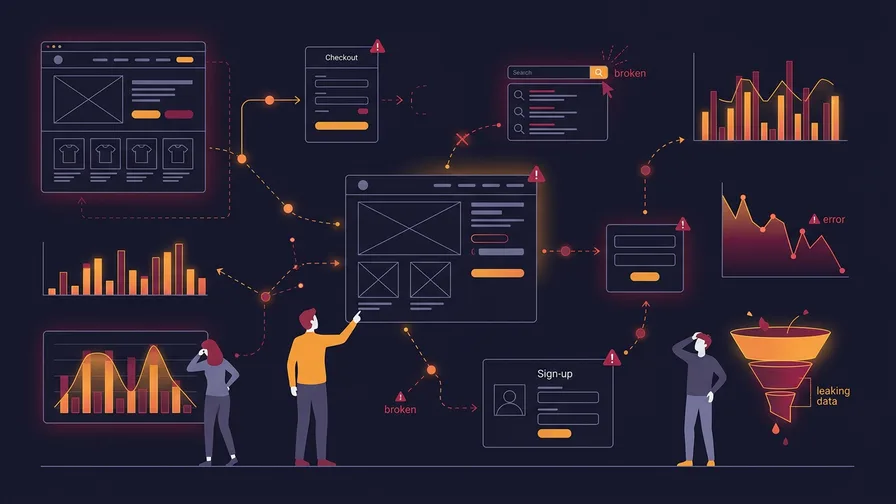
You open Google Analytics and immediately feel overwhelmed. Numbers everywhere. Graphs going up and down. Percentages that seem important but you have no idea what they mean or what to do about them.

Sound familiar? You’re not alone. Most small business owners know they should be tracking their website performance, but they get lost in the sea of data that analytics tools provide. The result? They either ignore analytics completely or get distracted by metrics that look impressive but don’t actually help their business grow.
Here’s the truth about website analytics for small business. You don’t need to become a data scientist. You just need to know which numbers actually matter for your bottom line and how to use them to make smart decisions about your website and marketing.
Why Most Small Businesses Get Analytics Wrong
Let’s start with the biggest mistake I see. Small business owners get excited about page views and sessions because these numbers tend to be large and go up over time. It feels good to say “We had 5,000 visitors last month!”
But page views don’t pay the bills. You could have 50,000 page views from people who hate your website, leave immediately, and never buy anything. Meanwhile, your competitor might have 500 highly engaged visitors who turn into loyal customers.
The problem with most analytics dashboards is they’re designed for large companies with dedicated marketing teams. These businesses need detailed data about user behaviour, attribution models, and complex conversion funnels. Small businesses need something much simpler and more focused.
Information overload is real. When you’re running a business, you don’t have time to analyse 47 different metrics. You need a small set of numbers that tell you clearly whether your website is helping or hurting your business goals.
This is why so many small business owners give up on analytics entirely. They think it’s too complicated, too time-consuming, or just not relevant to their day-to-day operations. But the right analytics approach can be a game-changer for small businesses.
The 8 Website Metrics That Actually Matter
Let’s cut through the noise and focus on the metrics that genuinely impact your business. These eight numbers will tell you everything you need to know about your website’s performance.

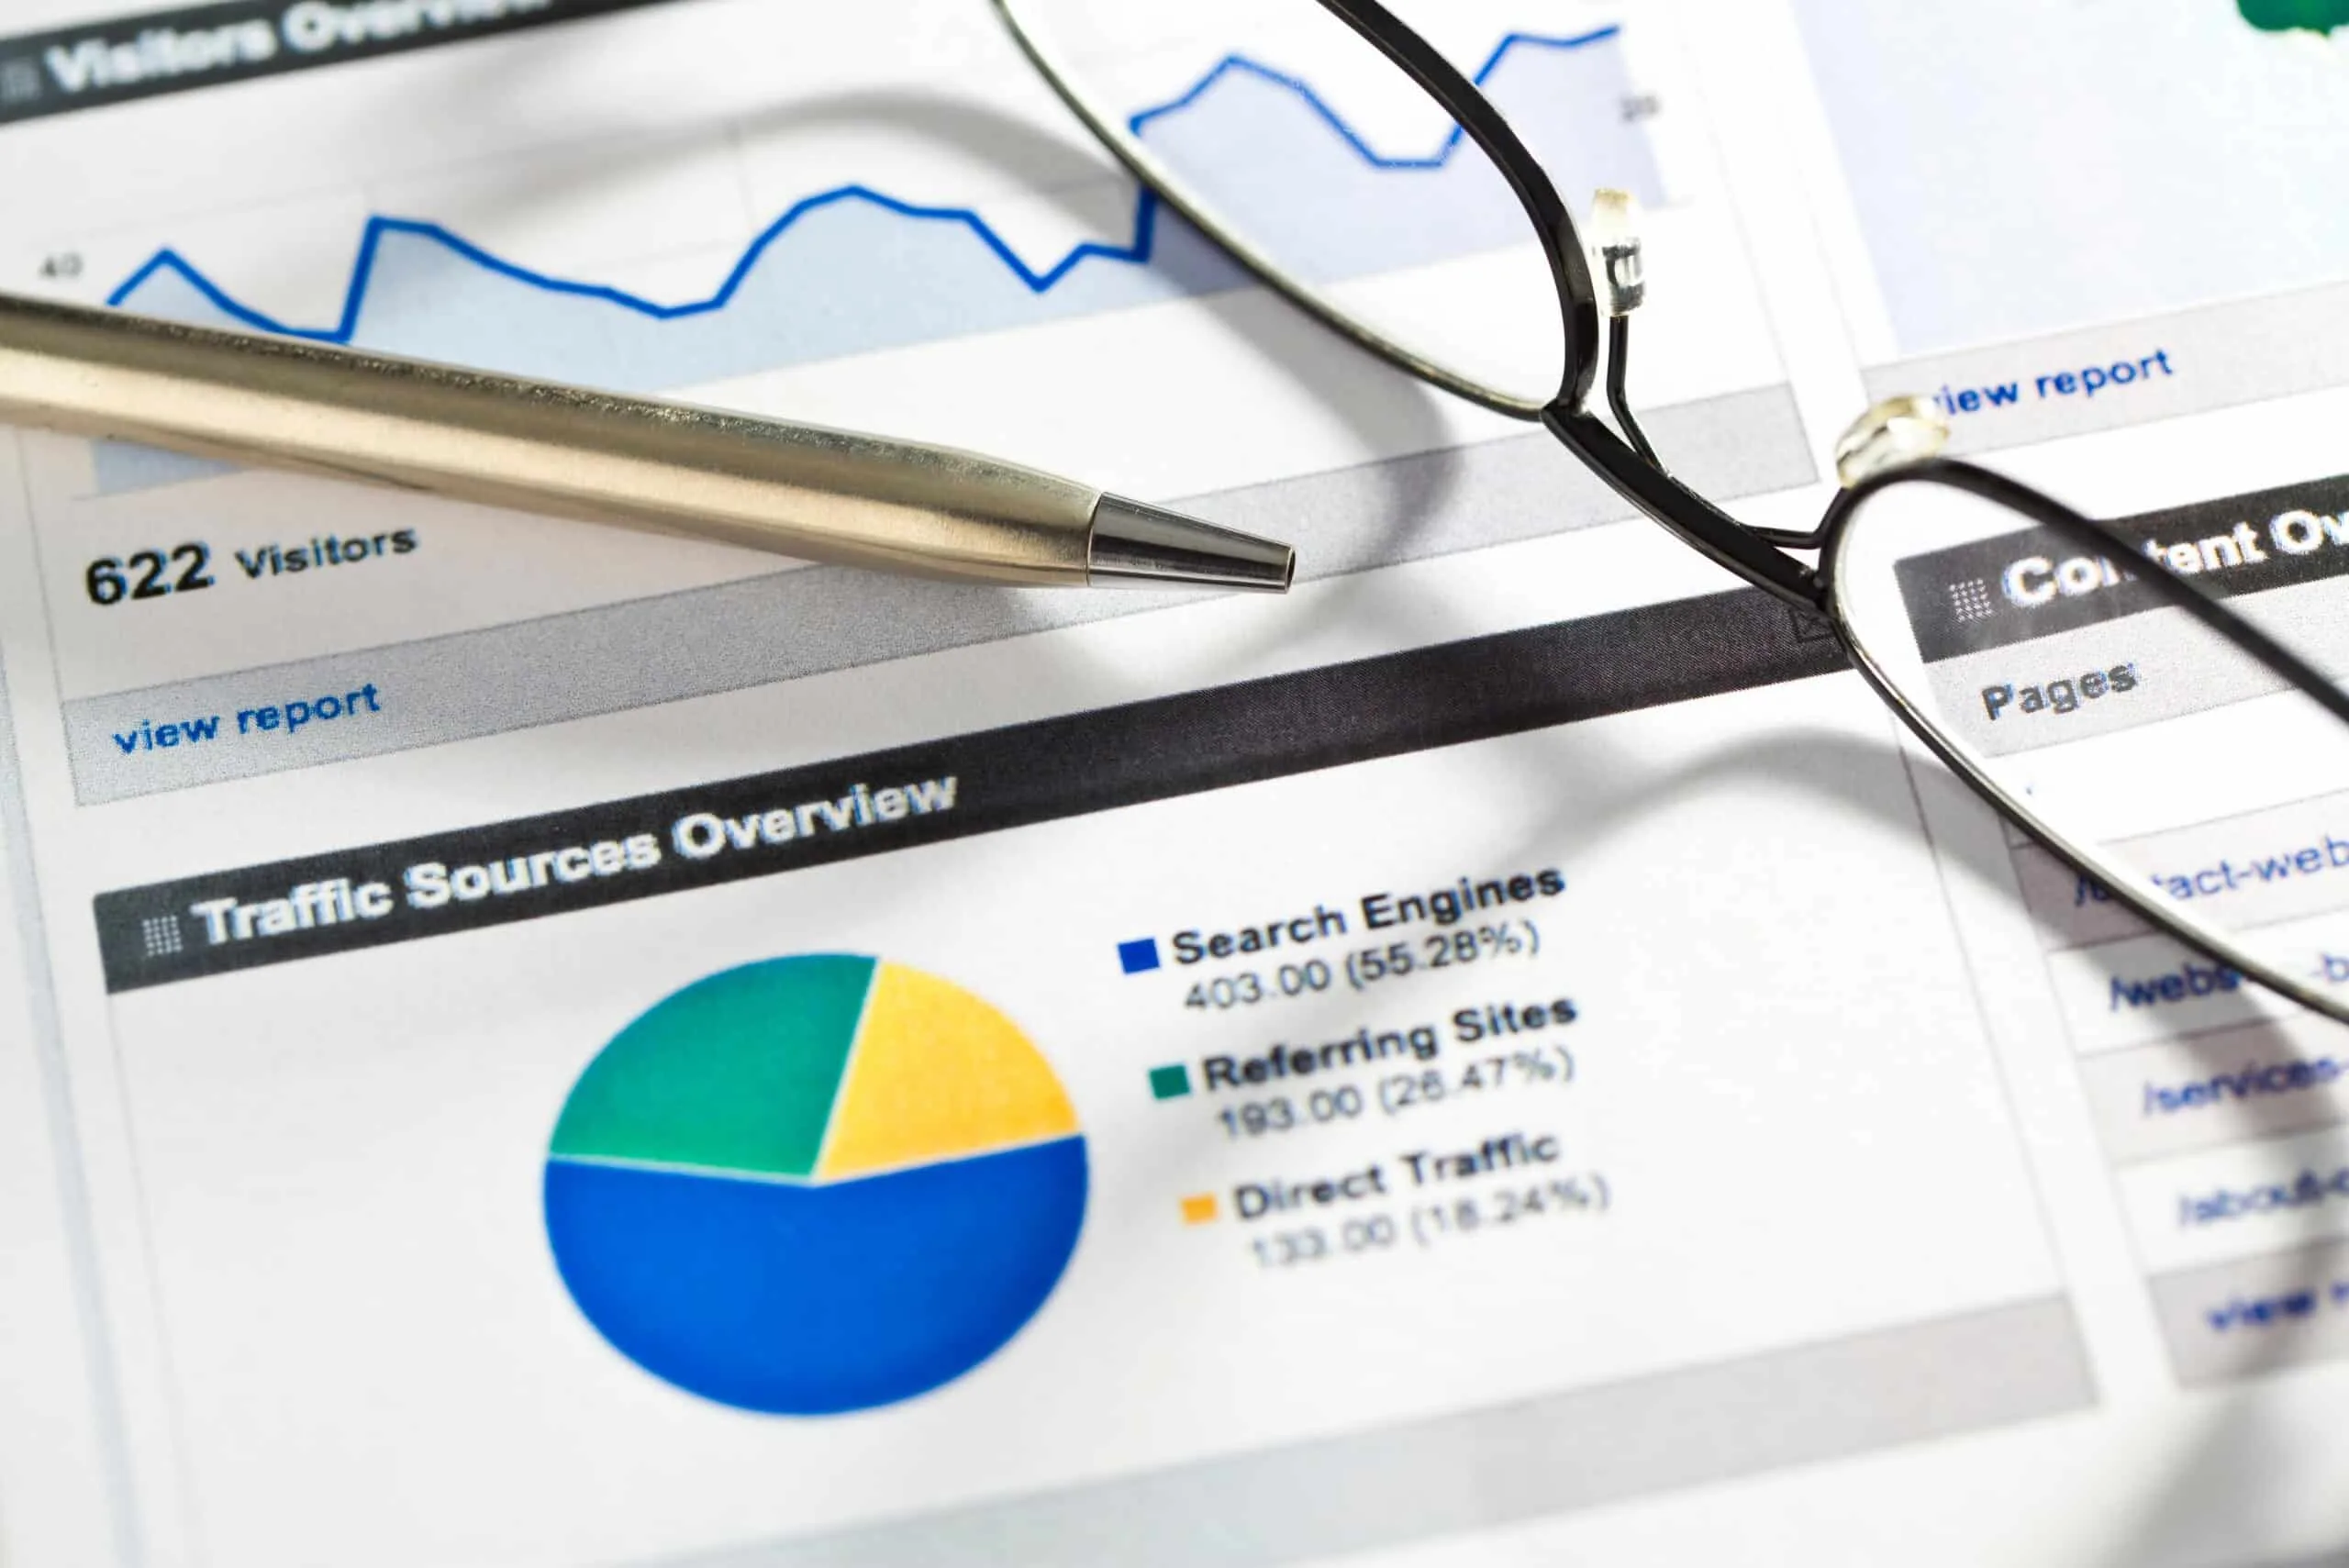
1. Traffic Sources (Where Your Visitors Come From)
This metric shows you whether people are finding your website through Google searches, social media, paid ads, or by typing your URL directly. For small businesses, this breakdown is crucial for budget allocation.
If 70% of your traffic comes from Google searches, that tells you organic search is working. If most visitors come from Facebook but none of them buy anything, you might be targeting the wrong audience on social media.
Organic search traffic is particularly valuable because these visitors are actively looking for what you offer. They didn’t stumble upon your business accidentally. They searched for something related to your products or services and found you. If this channel is underperforming, investing in search engine optimization is often the highest-return move a small business can make.
If organic search is low, our SEO improvement guide shows specific tactics to increase search visibility. Many small businesses miss opportunities simply because their websites aren’t optimised for the searches their customers are making.
2. Conversion Rate (Your Money Metric)
Your conversion rate is the percentage of visitors who take a desired action on your website. For e-commerce businesses, this might be making a purchase. For service businesses, it could be filling out a contact form or calling your phone number.
Here’s what good conversion rates look like for small businesses. E-commerce sites typically see 2-3% conversion rates, while service-based businesses might see 5-15% depending on their industry and how they define conversions.
Don’t get discouraged if your conversion rate seems low. Even a 1% improvement in conversion rate can significantly impact your revenue. If you get 1,000 visitors per month and improve your conversion rate from 2% to 3%, that’s 10 additional customers without spending more on marketing.
The key is understanding what actions matter most for your business and making sure your website guides visitors toward those actions clearly and efficiently.
3. Bounce Rate (The Engagement Indicator)
Bounce rate measures the percentage of visitors who leave your website after viewing only one page. A high bounce rate usually means visitors aren’t finding what they expected or your website isn’t engaging enough to keep their attention.
However, bounce rate needs context. A blog post that thoroughly answers someone’s question might have a high bounce rate because the visitor got what they needed. That’s actually good performance. But if your product pages or service descriptions have high bounce rates, that suggests a problem.
Industry averages vary widely, but most small business websites see bounce rates between 40-70%. Mobile visitors tend to bounce more frequently than desktop users, which is why mobile optimisation is so important.
Pay attention to bounce rate differences between traffic sources. If social media visitors bounce at 80% but Google search visitors bounce at 45%, that tells you something about the quality and intent of visitors from each source.
4. Page Load Speed (The Silent Sales Killer)
Page speed is one of the most underestimated metrics for small businesses. Research shows that 40% of visitors will leave if a website takes more than 3 seconds to load. That’s nearly half your potential customers gone before they even see what you offer.
Page speed affects everything else. Slow websites have higher bounce rates, lower conversion rates, and worse search engine rankings. Google uses page speed as a ranking factor, so slow sites get buried in search results.
The good news is that page speed problems are usually fixable. Common issues include large image files, too many plugins, and poor hosting quality. If your analytics show slow page speeds, our page speed optimisation guide provides specific technical solutions.
Small businesses often overlook page speed because it seems technical and intimidating. But improving your website’s loading time can have an immediate impact on all your other metrics.
5. Mobile Traffic Percentage
More than half of web traffic now comes from mobile devices, and for many small businesses, mobile traffic is even higher. Understanding your mobile traffic percentage helps you prioritise where to focus your optimisation efforts.
Mobile users behave differently than desktop users. They’re often browsing quickly, looking for specific information like your phone number, address, or business hours. They’re less likely to fill out long forms or navigate complex menus.
If 70% of your traffic is mobile but your mobile conversion rate is terrible, that’s a huge opportunity. Mobile optimisation isn’t just about responsive design anymore. It’s about creating an experience designed specifically for how people use their phones.
Look at the difference between mobile and desktop performance in your analytics. If there’s a big gap, mobile optimisation should be your top priority.
6. Top Performing Pages
Your analytics will show you which pages on your website get the most traffic and engagement. This information is gold for small businesses because it tells you what content resonates with your audience.
Free Offer
Want to know what's actually hurting your website?
We'll review your site and tell you exactly what to fix, no strings attached.
Get Your Free AuditMaybe your blog post about troubleshooting common problems gets more traffic than your main service pages. That suggests people are looking for helpful information, not just sales pitches. You could create more educational content to attract similar visitors.
Or perhaps one product page converts much better than others. Analyse what makes that page different. Better photos? Clearer descriptions? More customer testimonials? Apply those elements to other pages.
Top performing pages also reveal content gaps. If visitors spend lots of time on one topic but you only have one page about it, creating more related content could capture additional traffic and leads.
7. Goal Completions
Goals are specific actions you want visitors to take on your website. Setting up goal tracking is essential because it shows you whether your website is actually helping your business, not just attracting visitors.
For service businesses, goals might include contact form submissions, phone calls, or newsletter signups. E-commerce businesses track purchases, but they should also track email signups and product page views from first-time visitors.
The key is choosing goals that connect to real business outcomes. Don’t just track downloads or page views. Track actions that lead to customers, sales, or meaningful engagement with your business. Phone calls are particularly valuable for service businesses since they often represent the highest-intent prospects.
Goal completion data also helps you understand your customer journey. How many people visit your pricing page before contacting you? Do most customers prefer to call after visiting your about page, or do they fill out forms directly from your service pages? This information helps you optimise the path from visitor to customer.
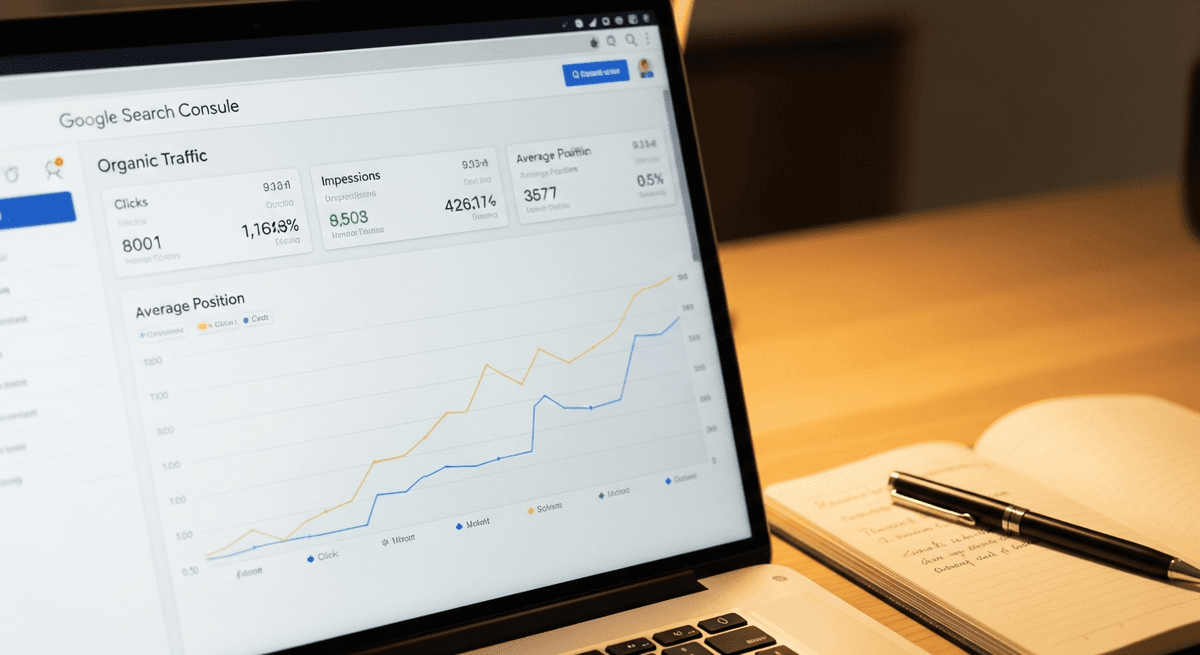
8. Search Performance Data
Search performance shows you how your website appears in Google search results. This includes which keywords bring visitors to your site, how often your pages appear in search results, and how many people click through to your website.
Google Search Console provides this data free, and it integrates with Google Analytics. You’ll see which search terms drive traffic and which ones show your website in search results but don’t generate clicks.
This information is incredibly valuable for small businesses. You might discover that you rank well for searches you never targeted, or that potential customers are searching for topics you haven’t created content about yet.
Search performance data also reveals technical issues. If your website appears in search results but gets very few clicks, your page titles and descriptions might need improvement.
Setting Up Google Analytics for Small Business
Google Analytics can feel overwhelming, but setting it up properly from the start saves hours of confusion later. The key is focusing on your specific business needs rather than trying to track everything possible.
Start with Google Analytics 4 (GA4), which is the current version. The setup process involves adding a tracking code to your website, but most website platforms like WordPress, Shopify, and Squarespace have simple plugins or built-in options for this.
Goal configuration is crucial for small businesses. Define what actions matter most for your business and set those up as goals in Analytics. This might be contact form submissions, phone calls, purchases, or newsletter signups.
Connect Google Search Console to your Analytics account. This gives you search performance data alongside your website analytics, providing a complete picture of how people find and use your website.
Create a custom dashboard that shows only the metrics that matter for your business. Hide or ignore the metrics that don’t connect to your business goals. This keeps you focused on actionable data rather than getting distracted by interesting but irrelevant numbers.
Reading Your Analytics Dashboard Like a Pro
The secret to effective analytics for small business is consistency, not complexity. Set up a routine for checking your numbers and stick to it. Weekly quick checks and monthly detailed reviews work well for most small businesses.
Focus on trends rather than daily fluctuations. Website traffic naturally varies day to day and week to week. What matters is the overall direction over time. Are your key metrics generally improving, staying stable, or declining?
Compare similar time periods when possible. Month-over-month comparisons are more meaningful than comparing random date ranges. Look for seasonal patterns in your industry and plan accordingly.
Pay attention to correlation between metrics. If traffic increases but conversion rate decreases, that suggests you’re attracting lower-quality visitors. If bounce rate improves but traffic drops, you might be losing potential customers who would have converted despite initially bouncing.
Don’t make major changes based on one week of data. Small businesses especially need to let changes run long enough to see meaningful results. Most website optimisations need at least a month to show clear impact.
Turning Data Into Action: Monthly Review Process
Here’s a simple 30-minute monthly review process that will help you use analytics to actually improve your business rather than just understanding what happened.
Start by checking your goal completions. Are you getting more or fewer leads, sales, or other important actions compared to last month? This tells you immediately whether your website performance is moving in the right direction.
Review your top traffic sources. Which channels are growing and which are declining? If organic search is dropping, that might indicate SEO issues or increased competition. If social media traffic is increasing but not converting, you might need to adjust your social media strategy.
Look at your top performing content. What pages are people spending time on? What topics are resonating with your audience? This information should guide your content creation and marketing efforts for the coming month.
Check your mobile performance. With mobile traffic continuing to grow, any gaps between mobile and desktop performance represent lost opportunities. Mobile optimisation often provides the highest return on investment for small businesses.
When analytics consistently show poor search performance, professional SEO services can address the underlying technical and content issues that small business owners often can’t identify or fix alone. Sometimes the best use of analytics data is recognising when you need expert help to improve the numbers. A good first step is running a free website audit to surface the specific issues holding your site back.
Common Analytics Mistakes to Avoid
The biggest mistake small businesses make is focusing on vanity metrics like page views and session duration. These numbers can be interesting, but they don’t directly impact your bottom line. Focus on metrics that connect to business outcomes.
Don’t make decisions based on insufficient data. Small businesses often don’t get enough traffic to make statistically significant conclusions from short time periods. Wait for enough data before making major changes to your website or marketing strategy.
Ignoring mobile performance is increasingly costly. Many small business owners primarily use desktop computers, so they don’t realise how poor their mobile experience is. But if most of your customers are on mobile devices, mobile performance determines your success.
Not setting up proper conversion tracking means you’re flying blind. You might think your website is performing well because traffic is increasing, but without conversion tracking, you don’t know if those visitors are actually becoming customers.
Finally, don’t let perfect be the enemy of good. You don’t need to track every possible metric or create the most sophisticated analytics setup. Start with the basics, get comfortable with those numbers, and add complexity gradually as needed.
Frequently Asked Questions About Website Analytics
How often should I check my website analytics?
For most small businesses, weekly quick checks and monthly detailed reviews provide the right balance. Daily monitoring can lead to overreacting to normal fluctuations, while checking less than monthly means missing important trends or issues.
What’s a good conversion rate for small business websites?
Conversion rates vary significantly by industry and how you define conversions. E-commerce sites typically see 2-3%, while service-based businesses might see 5-15%. Focus on improving your own conversion rate over time rather than comparing to industry averages.
Should I focus on increasing traffic or improving conversion rate first?
For most small businesses, improving conversion rate provides faster and more cost-effective results than increasing traffic. It’s easier and cheaper to convert more of your existing visitors than to double your traffic while maintaining the same conversion rate.
Understanding your website analytics doesn’t have to be complicated or time-consuming. Focus on the metrics that directly impact your business goals, set up a consistent review process, and use the insights to make gradual improvements over time.
The goal isn’t to become an analytics expert. The goal is to use data to make better decisions about your website and marketing efforts. When you focus on the right numbers and act on what they tell you, analytics becomes a powerful tool for growing your small business.
Ready to improve your website’s search performance and organic traffic? Learn about our SEO services and how we help small businesses optimise for the metrics that matter most.